Excited to unveil “Pedigree Forge,” the software I use for crafting my professional family tree charts! 🌳 Currently seeking beta testers in the UK for Windows 10/11. Interested? Sign up here: https://www.mrgenealogy.co.uk/pedigree-forge
Presentation of Family Tree Charts
For many people, the centrepiece of family history research is a family tree chart—the culmination of the hard work to find the information and a visually pleasing document to behold and display.
Whilst the above is true, family charts also need to play a functional role: they are the means by which the connections between generations are communicated and navigated. In the same way that a graph helps communicate numeric data, family tree charts communicate genealogical information.
Having worked with many clients over the years, they often go on a journey in regard to what they want from family tree charts. The initial expectation is that they want a vast family tree, showing everyone, but as they learn more about their ancestors, they tend to realise that a set of well thought-out charts are far better at understanding their relations and are also more visually pleasing; they also discover that different kinds of charts are best suited for various tasks.
In mathematics and statistics, there are different kinds of graphs and charts: Line Graphs, Bar Charts, Pie Charts, Histograms, Scatter Plots, Venn Diagrams, Area Charts, Spline Charts, Box and Whisker Charts, etc… In genealogy, we have different kinds of charts too, although they can be split into two broad camps: ancestors or descendants. Ancestor charts start from someone and work backwards; Descendant charts start from someone and work forward. They can be mixed in limited circumstances, but just as combining a bar chart and a pie chart would likely make both harder to understand, so does mixing ancestor and descendant charts. Usually, the information is better considered as two charts, rather than as a single chart.
One of the biggest problems that makes charts hard to understand is when connecting lines cross. Only a few aren’t a problem, but the more there are, the more spaghetti like a chart becomes.
Ancestor Charts
These start from a person, usually someone alive today, and work backwards, showing their parents (2), grandparents (4), great grandparents (8), great, great grandparents (16), etc. They don’t show their aunts, uncles, cousins, great aunts and uncles, as this data would be too confusing. On a technical level, to add these other relatives would mean that many of the connecting lines would have to cross one another.
Descendant Charts
These start from an ancestor, or sometimes an ancestral couple (usually placed at the top of the chart), and work forward, showing their descendants, at least along the lines being investigated. This kind of chart is what most people, at least in Britain, would think of as a traditional family tree and sometimes called a drop-line pedigree chart. This kind of chart does show siblings, aunts, uncles, cousins (at least to the degree to which they have been researched), but only those who are descended from the ancestral starting point.
In the strictest traditions, descendant charts would only follow the male lines forward; when a lady married, her children would be shown on her husband’s family chart. This has the side effect that the main people on this chart would usually share a birth surname, or married someone with that surname. Whilst this is old-fashioned, it does enable a chart to be grouped in a logical way, i.e. by surname.
When considering any individual, they would have a range of descendant charts one which they had ancestors, most closely, their mother’s and father’s charts, but of also those of their grandmothers and beyond.
With the exception of cousin marriages, which were once quite common, by starting with a single ancestor (or couple) and working forward, their should be no crossing lines.
There are several “rules” with drop-line charts, that are generally applied:
- Children should be placed in birth order, left to right. In very old charts, all the boys were placed first, then the girls, as in peerage families the girls didn’t inherit until there were no surviving sons, but quite rightly, that sort of attitude has gone.
- Husbands are usually placed to the left of their wives, unless there is more than one, in which case the wives would flank him on either side.
- All descendants at the same level should be on the same row of the chart. This helps to prevent confusing of a cousin with an aunt or uncle.
- Family charts should contain the right level of detail. Lots of information is better provided in narrative form, but there should be enough to help distinguish each person and have the key details about their lives.
- Uncertain information shouldn’t be shown as certain. For example, charts should contain question marks or dotted lines if some fact or relationship hasn’t been proven.
These rules can be broken in some circumstances. For example, sometimes for the sake of space, a more pleasing chart could result if rule 1 (ordering of children) is broken, but under such circumstances, it would be usual to place numbers next to the children to show that the birth order is
There are also some softer rules, which are perhaps a matter of taste:
- Boxes shouldn’t be drawn around each person. A lot of modern computer software does this, but—in the author’s opinion—this clutters a chart (few professional trees would include boxes around each person).
- Use of fonts and colours should be limited and carefully chosen. Many computer programs generate charts that don’t make the most tasteful choices in regard to use of colours and fonts.
- A chart shouldn’t be too big or too small. Sometimes it is better to break a rule to create a more visually pleasing chart overall, rather than stick strictly to one of the defined rules. This can be taken to an extreme, a chart that is too small, or broken into too many pieces can also be too hard to understand. Often a human, rather than a computer, is better placed to decide how big a chart should be, and which rules should, or shouldn’t be broken, to create a chart that.
You may thing from the soft rules above, that I am anti the use of computer software when creating family tree charts. The reverse is actually true; I have written my own computer software which I use to create my family charts, but which allows better customisation and layout of trees than the commercially available software. I will perhaps look at some of these design choices in future blog posts.
Bibliography
Lynskey, M. (1996), Family Trees, A manual for their design, layout & design, Phillimore & Co. Ltd.
McLaughlin, E, (1996). Laying Out A Pedigree, McLaughlin, (2nd Ed.)
Herber M. (2005), Ancestral Trails, (2nd Ed.) Sutton Publishing
Examples of surname variant spellings
This is the third in a series of post on variant spellings of surnames. Today, I will give some examples of variants I have encountered to illustrate how different they can be. These are all from projects where the evidence is clear that the variants do relate to the same family.
- Goodrum or Gooderham
- Gibson or Gipson
- Oram or Horam or Whoram
- Elstrop or Healstrop or Heelstrop
- Doughty or Daughty or Dufty
- Dew or Dow or Doe
Particularly troublesome amongst name variations are those where the initial letter changes (like Oram/Horam/Whoram). This is because some of the computer algorithms used to help search computer databases often aren’t clever enough to pick-up on this kind of variant, and this is why looking at original documents is useful—by looking page-by-page at a parish register, it encourages the researcher to consider if the name written down might be a variant. On many occasions in my work, I have been able to progress a family back further by looking at an image of a document itself, not relying on a computer database or index.
Why are names sometimes written wrongly?
Carrying on from my post last week about spelling variations of names—particularly surnames—it is worth considering why a name might be written differently than what might be expected.
Phonetic spellings
On many occasions, it wasn’t even our ancestors who wrote their names down. The name would have been said to a scribe, and the said scribe would have been the one who wrote the name down. For example, if a couple wed at a church, the bride and groom would have spoken their names and then those would have been written in the register by the official conducting the ceremony. From 1754 in England and Wales, the bride and groom should have signed their names, but you will often find that these were simply crosses, described as their marks, i.e. they couldn’t write their names. On many occasions, they wouldn’t know how to read their names either, and so would have no idea if the name was written “wrongly”.
A local scribe, marrying a local couple, would probably have a better idea of how the name was written than if one of the parties were from further away. The different accent and unfamiliarity to locally occurring names means that if an ancestor moved a long way that the variations can be quite extreme, or may have been modified into a name that the scribe was more familiar with. A non-local accent could also change what the scribe thought they heard.
Copying or transcription errors.
This happens when someone couldn’t read what was originally written and so an error was introduced. That someone might be a modern transcriber or indexer, trying to make the best out of a poor quality image or damaged document. This is what often occurs with indexes and why you should always look at the original document rather than relying on an index. The copying error might have happened much closer to the event. For example, what we see today for censuses prior to 1911, aren’t the original forms completed by our ancestors, but they are compiled lists created by the enumerators from the said forms. Whenever something is copied, errors can be introduced.
There are of course of reasons too, but the above probably cover in excess of 80% of name variation occurrences, at least for non-permanent and not deliberate changes.
That can’t be my ancestor because I don’t spell my name that way!
One aspect of genealogy that often catches new researchers out is the spelling of names, particularly surnames. They apply the modern unchanging view of spelling onto the lives of their ancestors: they assume that because they spell the name in a particular way, that their ancestors names will always be written that way too.
That assumption is wrong. Your ancestors names will be written with a variety of spellings.
As rule of thumb, the further back you go, the more likely the name is to appear with different spellings, but as we shall see in the following example, sometimes you don’t have to go back that far at all.
My paternal grandmother’s father, Frederick Thomas Harden, was born in December 1893 and lived until 1978, only just before I was born, yet his official birth certificate has the wrong spelling of the surname, that is as Harding rather than Harden.
Below is the main data from his birth certificate, which was registered in early-January 1894:
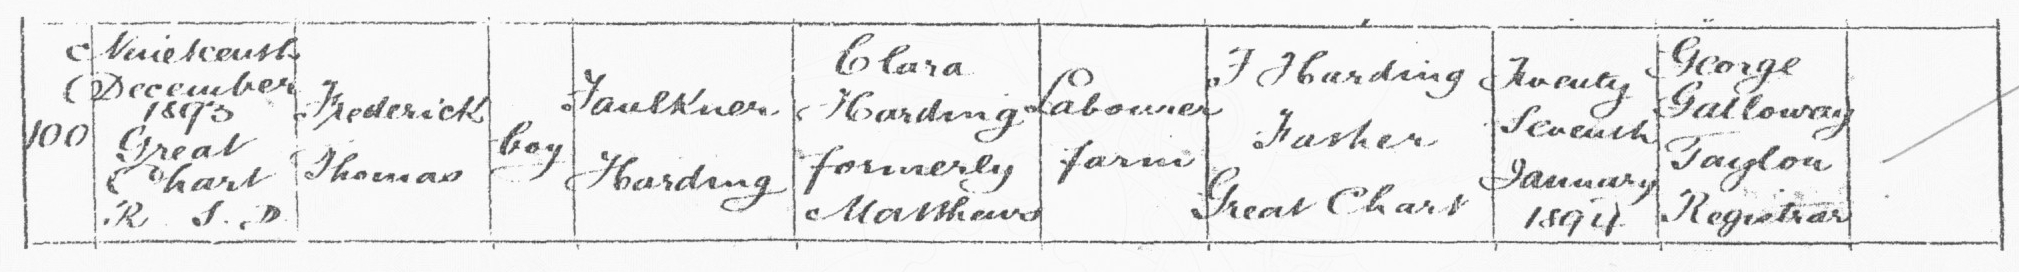
Every other document on which Frederick is recorded has the spelling Harden, including: his baptism at Great Chart in early 1894, his first and second marriages, the registration of his death, census returns, the 1939 register and his WWI army service records.
This particular case is most likely due to an administrative copying error; the records issued by the General Register Office are copies of the registers held by the local registrar. Perhaps the registrar George Galloway Taylor had rather messy handwriting. Frederick’s mother’s maiden name was also wrong on this document; written as Matthews here, the more usual spelling was Mathis.
There are two ways to consider different spellings, firstly there are deviants, these are strange spellings which are more likely due to a single copying error. The other are variants, which are where the name appears in many records with a different spelling. This example, at least at this point in history, is more of a deviant.
Birth Places on 1841 Census?
The 1841 census wasn’t the first taken in the United Kingdom, but it was the earliest to record the names of every individual and the earliest to survive in a form that is of widespread use to genealogists. Earlier censuses (1801, 1811, 1821 and 1831), either survive as statistics only, or for a few parishes there are drafts used to calculate the numbers involved, such as lists of households, often in the miscellaneous documents collectively termed parish chest records.
Compared with later censuses, that of 1841 had some big limitations:
- Ages of those over fifteen were supposed to have been rounded down to the nearest multiple of five years, although this wasn’t always applied. For example, if someone was recorded as 30, and assuming that they knew their age accurately, this implied that they could be nearly 35, and so nearly five years older than their age as recorded would suggest.
- Relationships within households weren’t documented, and so what looks like a father, mother and children, might not actually be that, for example, the children might be a visitor, niece, or nephew.
- Only one given (no middle names) were supposed to have been recorded.
- Exact places of birth weren’t written, only if the person was born in the same county that they were then living was stated, or if they were born in England, Scotland, Wales, Ireland or foreign parts.
Whereas the first few points can often be recreated from other records, if the individual died before the next census was taken in 1851, the place of birth is the hardest to recreate.
I look through a lot of censuses when undertaking research, and I have come across one institution that did record places of birth. This was the Upper Trinity Ground, Deptford, which were almshouses for merchant mariners. The enumerators had also tried to use exact ages, rather than rounding down, and written the places of birth across the final two columns, which usually just had a “yes” or “no” in them, so for around 100 individuals, this detailed information survives. As these were almshouses, many of the inhabitants were quite elderly, one of them, Naomi Thompson, was 87, so born about 1754, and stated to have been a native of Great Yarmouth. What is also lovely about these records is that they can often be tied in with the Trinity House Calendars, made by the Society of Genealogist, which give further details [https://search.findmypast.co.uk/search-world-records/british-mariners-trinity-house-calendars-1787-1854].
By using these two sources, I managed to trace a client’s ancestor back to Whitby in Yorkshire—many people have the same person in their online trees, but have assumed wrongly that he was from London and consequently have completely the wrong lineage before him.

Seven Sins of Genealogical Research—(1) Copying online trees
The major family history websites make claims of how easy it is to research your ancestry. Whilst it is true that you can `just type in a name’, often what you then get is heavily based on what other members have researched in the past. The quality of this varies from very good, to complete fiction; the issue is how do you know if it is reliable or not?
As a professional genealogist, I often get asked to start with work that clients have done on one of these websites, and so I have a lot of experience with looking at members’ trees and then obtaining proper proof to see that it is correct. I have to say the majority of these trees have major errors in them. By that, I mean that they contain a mistake and are following the wrong family, at least on some branches.
I have had clients say to me that a lot of other people have the same information, and often this is the case. However, sometimes the more people that have copied the information, the less reliable it actually is. I think it is because those that copy a lot tend not to be as careful with the research and so the errors get propagated in a similar way that fake-news spreads. On many occasions, I have had a situation where perhaps 20 members have concluded one thing but 2 members have concluded something else, and it is very often the minority that are correct!
By all means, use other members online trees as a resource, but be very wary of the information that they contain; Do not assume that they are correct, even if a lot of people have the same information, and always verify the details yourself. And please do not perpetuate the misinformation if you aren’t sure, then mark the fact as questionable in your tree. Avoiding the next sins will help you make sure your research is accurate.
Assistive Technology in Genealogy
This is a very short blog post reaching out. I am currently looking at assistive technologies in genealogy, particularly in regard to adapting family tree charts for use with screen readers. If anyone knows of any prior-art or resources, I would love to hear from you.
Interview for McCarthy and Stone for their website.
I recently did an interview for the McCarthy and Stone Life and Living Magazine. You can read the interview on their website here: https://www.mccarthyandstone.co.uk/life-and-living/explore/lifestyle/expert-advice-tracing-your-family-tree/
It’s a small world…
It’s surprising how often little coincidences appear when I do research for clients. I am usually working on about 5 to 10 clients work at one time; two of the projects I am working on at the moment both have links with Milford Haven in Pembrokeshire… And both clients had ancestors who lived in Pill Road in the town.